Dot Matrix LCD Sniffer
On a flea market I bought 25 years old spectrophotometer (Ultrospec 1000E), operated thru keyboard, displaying results on 128x64 pixels LCD display.
Spectrophotometer is an instrument that measures absorbance or transmittance of light at different wavelengths. It consists of light source (tungsten halogen and deuterium arc lamps), monochromator and photoelectric sensor (photodiode): https://en.wikipedia.org/wiki/Spectrophotometry My spectrophotometer measures absorbance or transmittance of light between 200nm (UV) and 900nm (IR). Visible spectrum has wavelengths between 380nm and 750nm. Spectrometer has Hitachi control unit (with H8 processor), keyboard and LCD display.
For simple measurement you enter the wavelength and read the result on LCD display. For absorbance/transmittance spectrum you set wavelength range and let the machine change the wavelengths and display results. Of course, I would like to have spectrum saved as XLS/CSV file and displayed as a graph on the computer screen.
At the back of the unit there is a 25 “Centronics” connector that should print graphs on EPSON dot matrix printer. But this unit is “educational” and printer port is disabled. Googling around I discovered that there is Analog output on pins 24, 25, so I could read the absorbance as voltage, but not wavelength.
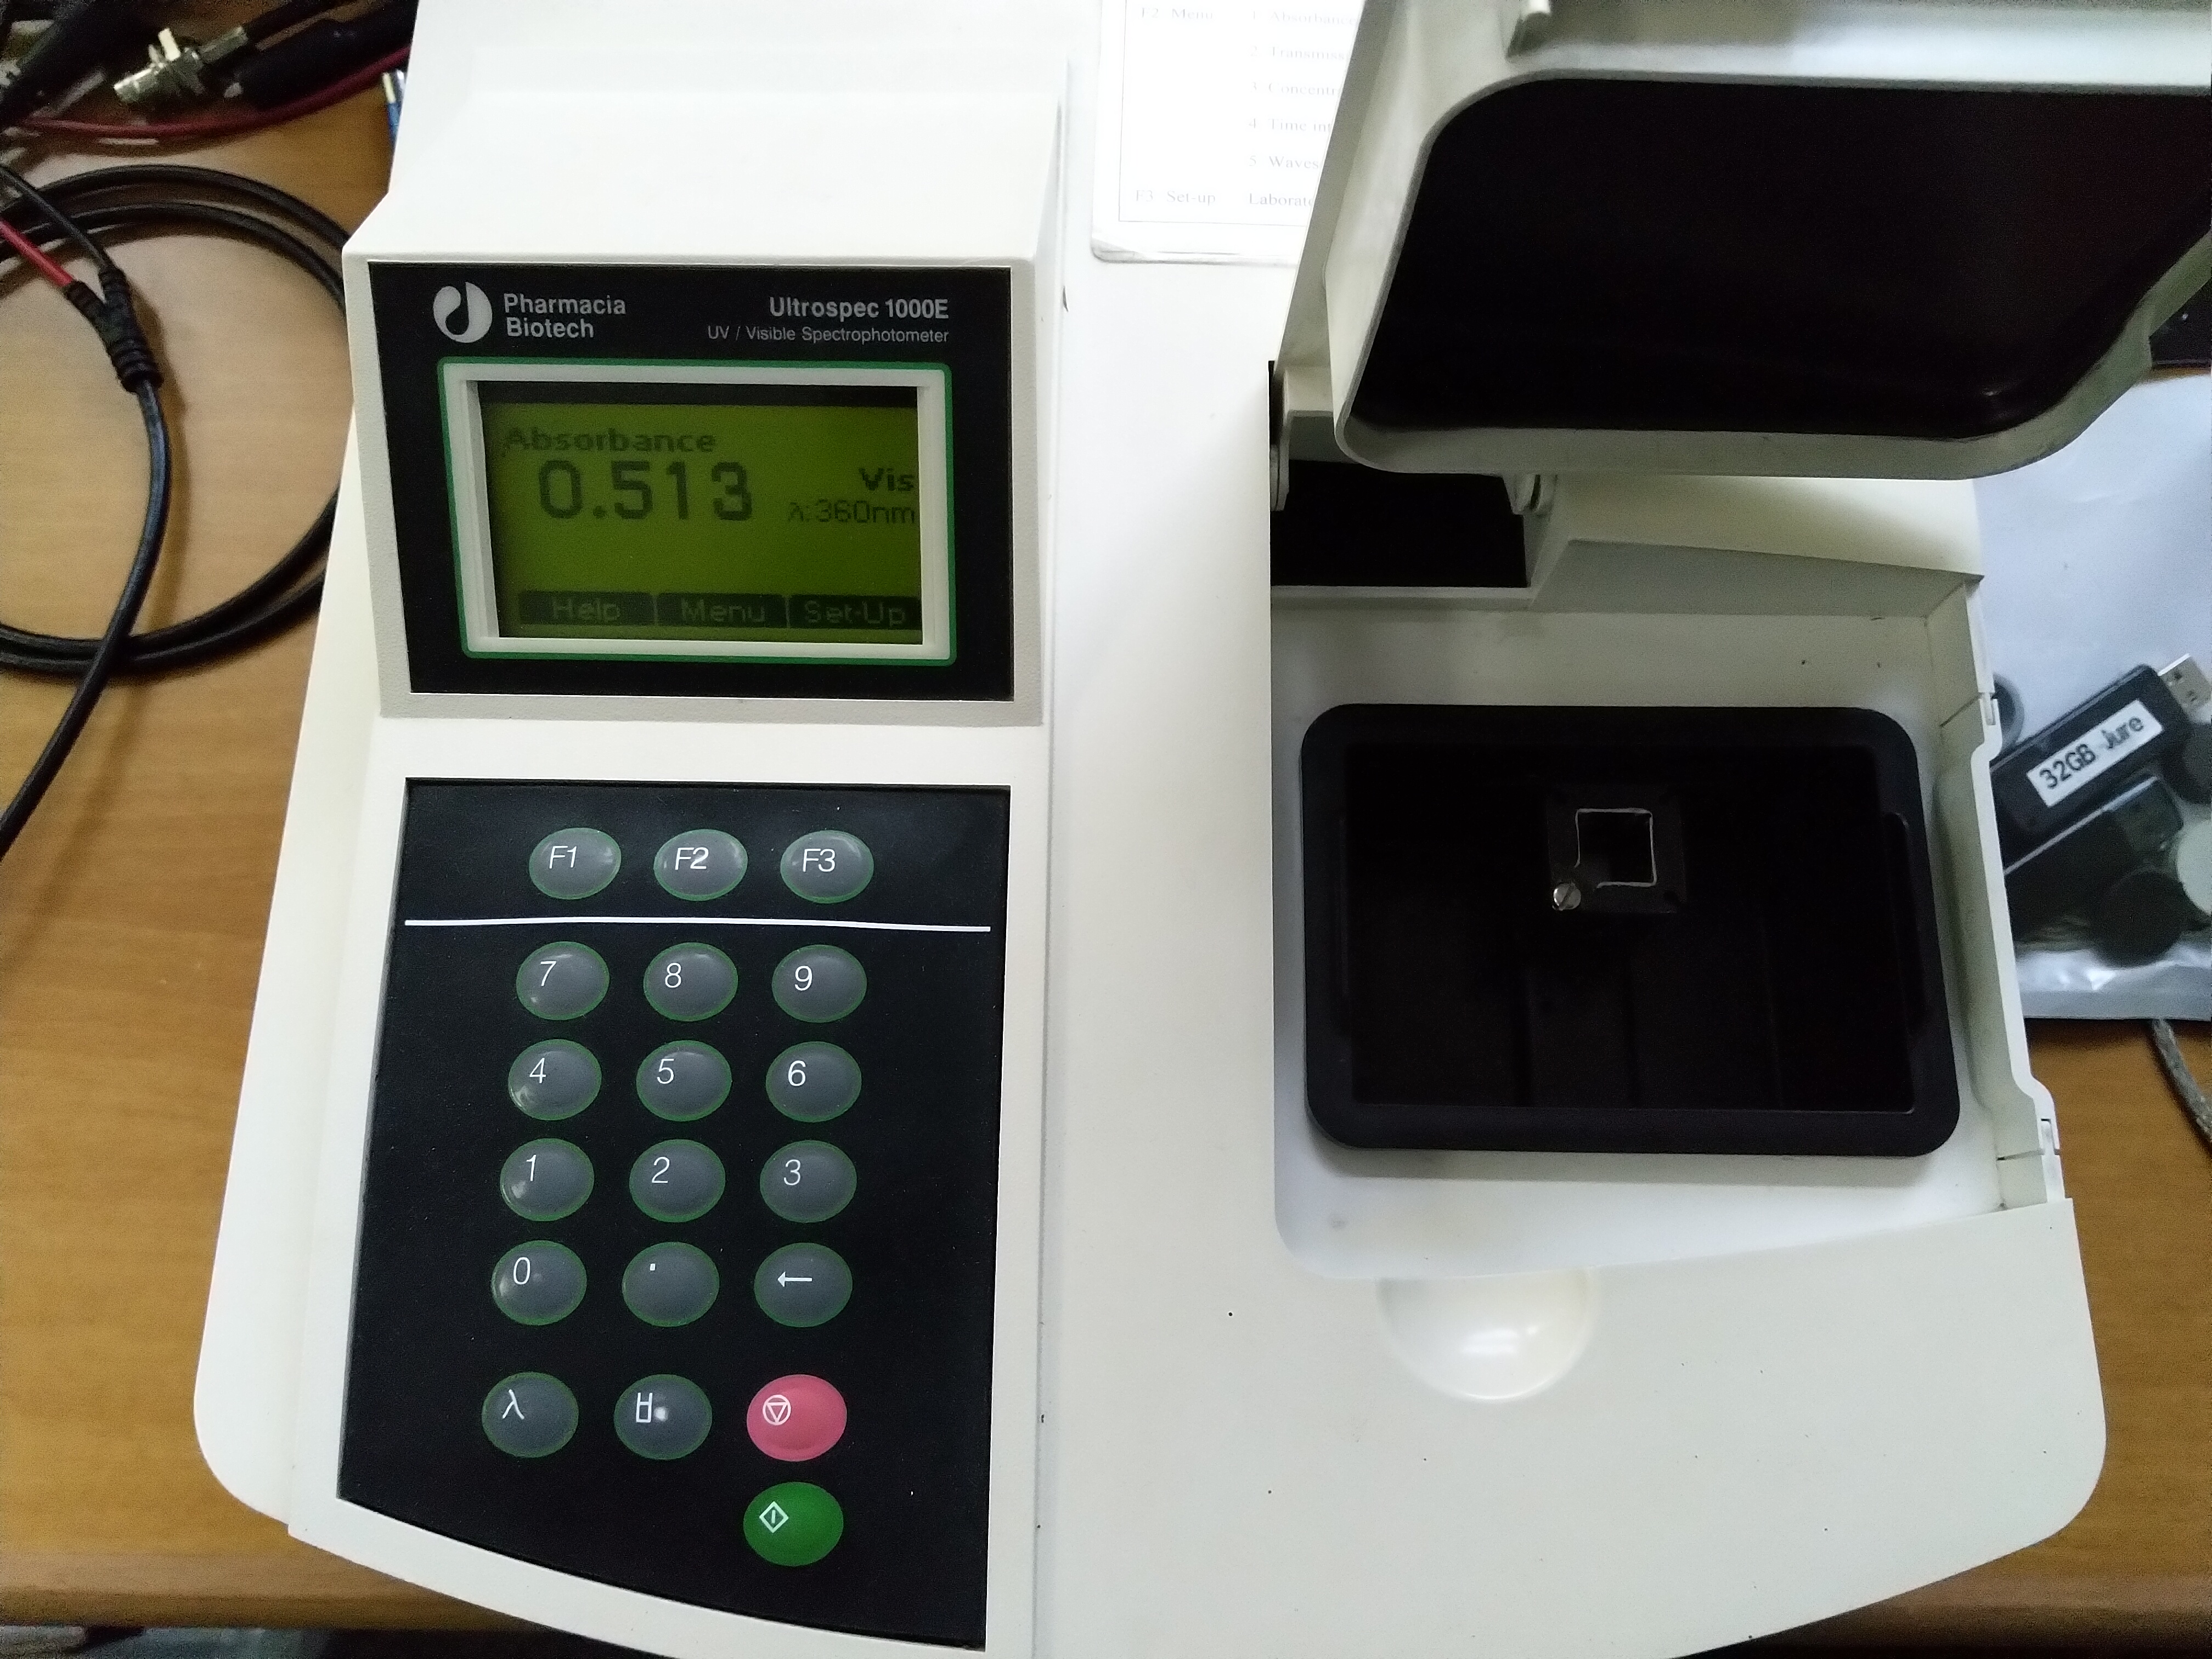
Pic 1: Spectrophotometer Ultrospec 1000E
As there is no computer interface [1], I decided to sniff[2] the LCD connection (PC-1206B WAYTON M.I.T.).
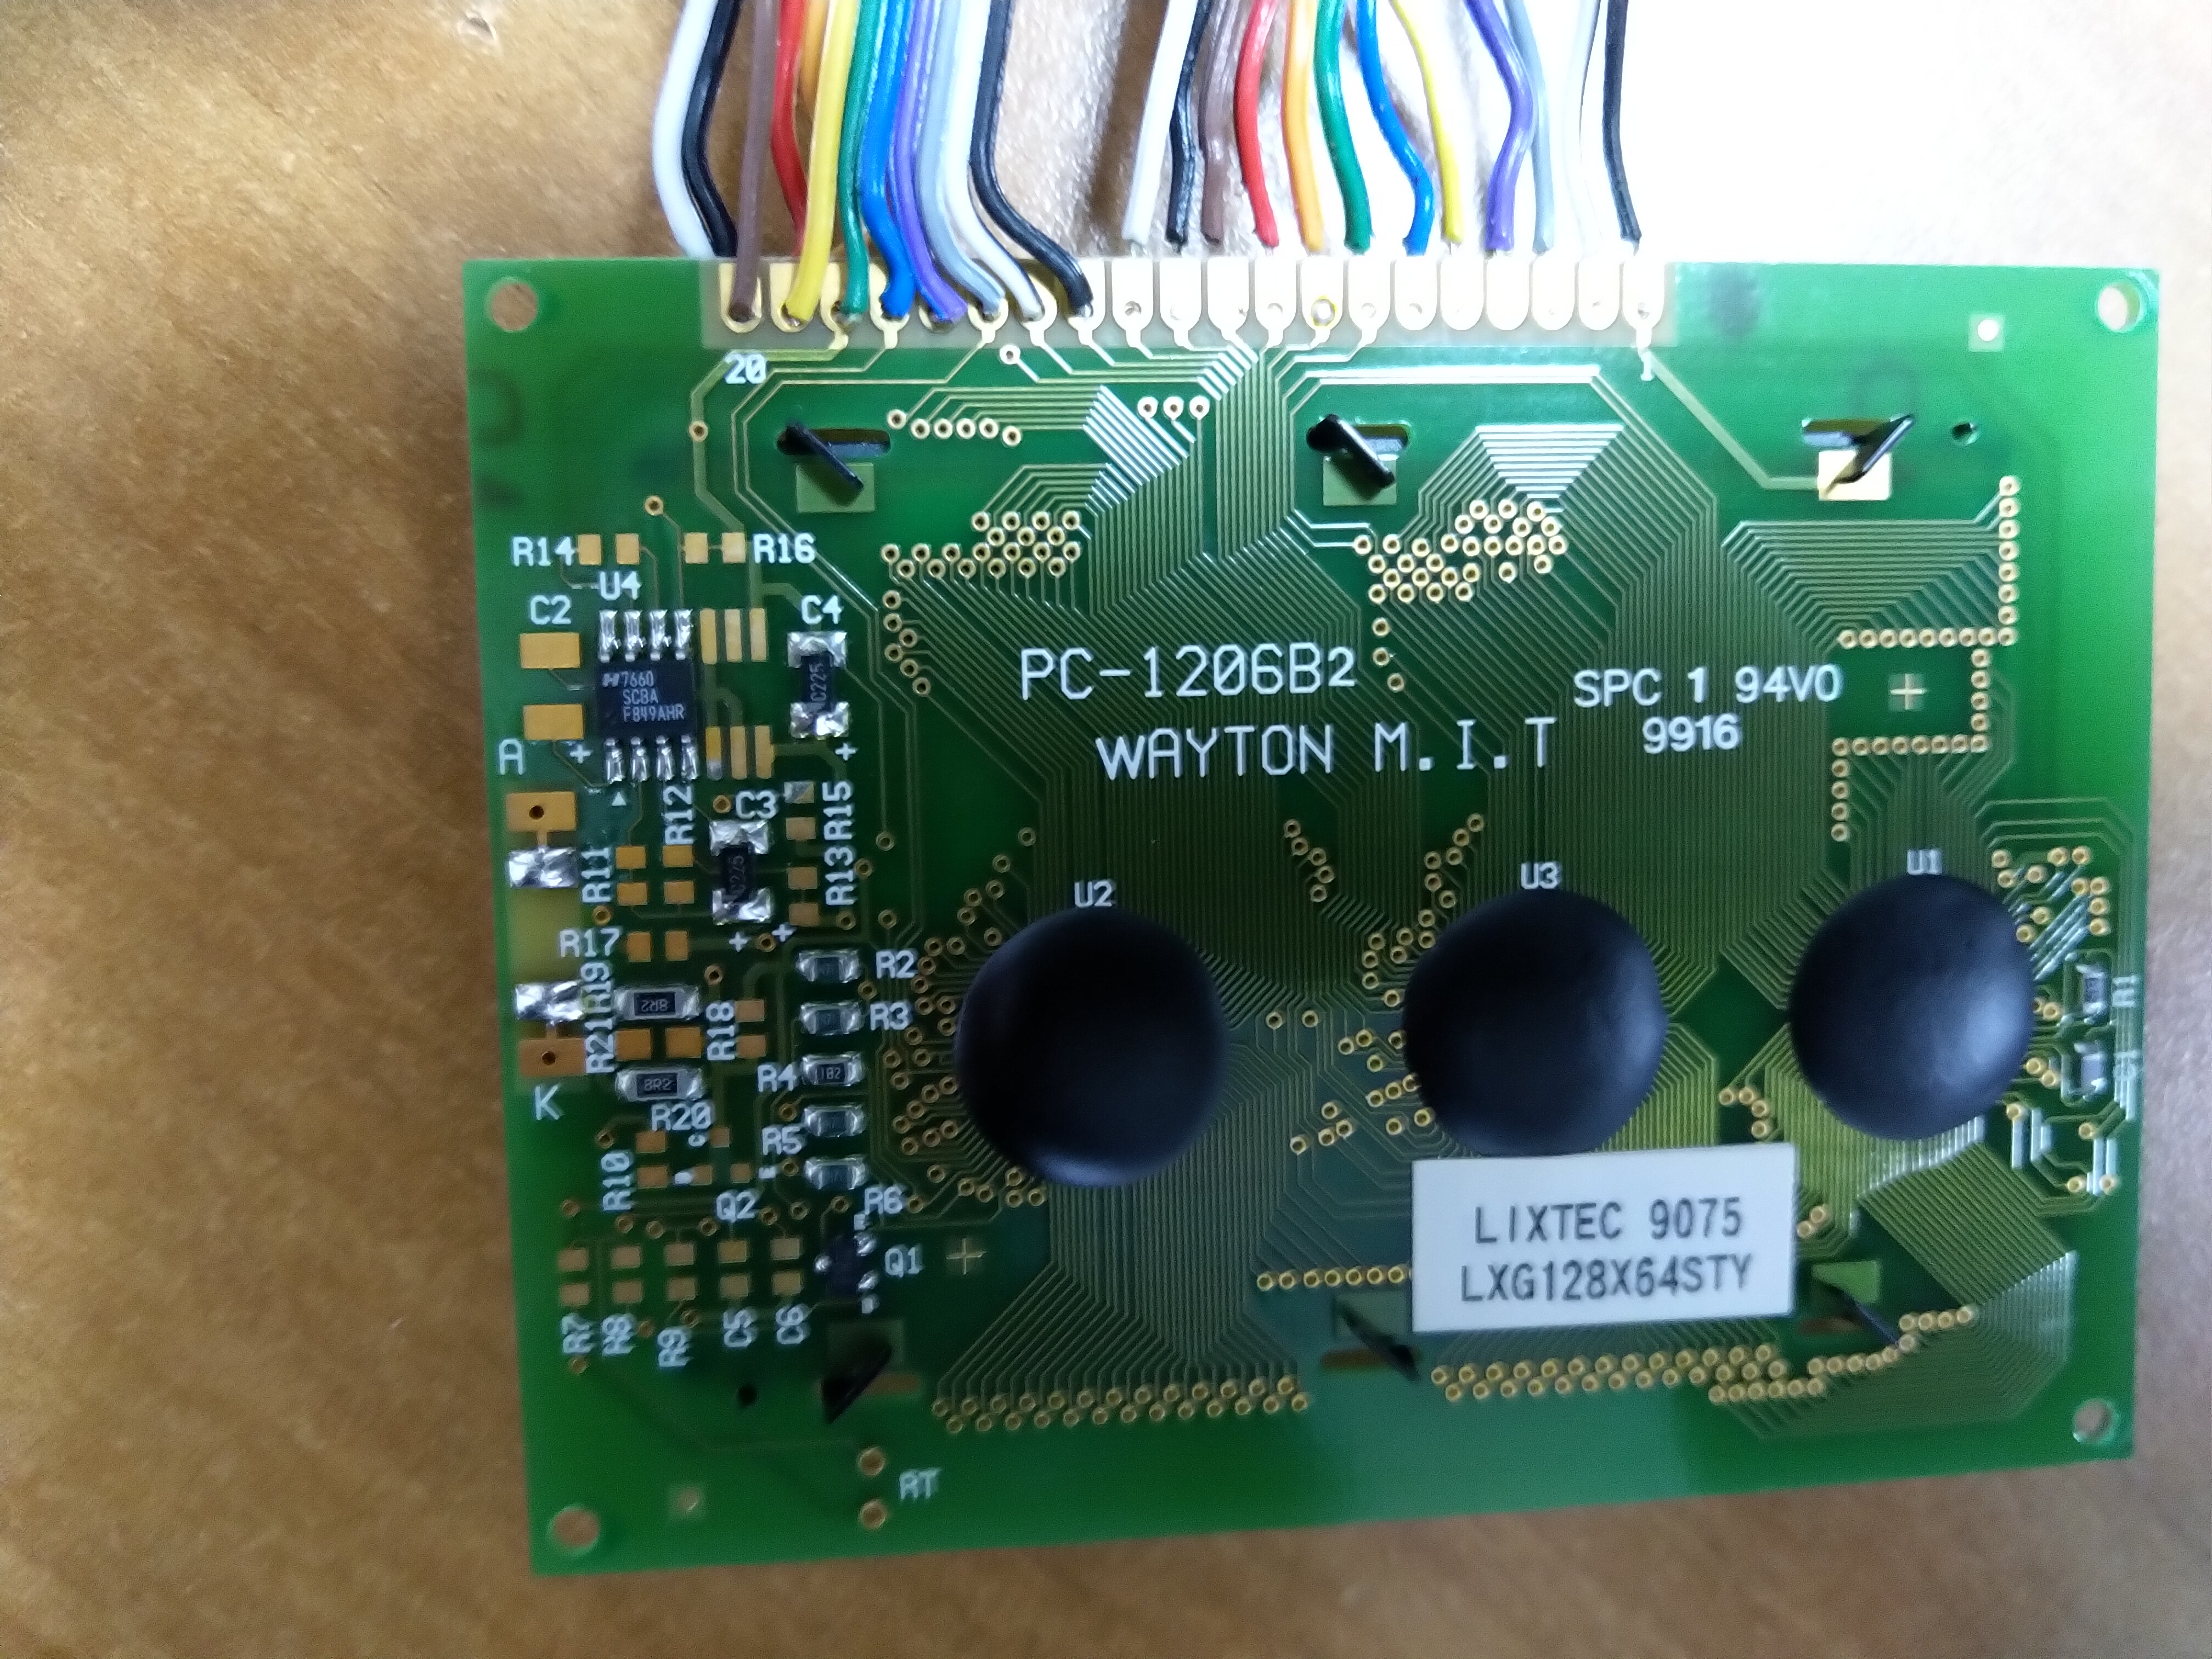
Pic 2: Back side of LCD display
LCD display has standard 20 pins connector. I made a simple splitter to connect 16-bit logic analyzer (Kingst and Saleae) to pins 4 – 16 (13 wires + Ground) and observed the signals.
|
LCD PIN |
Logic Channel |
|
|
|
1 |
|
GND |
Ground |
|
2 |
|
+ 5V |
Power + |
|
3 |
|
- 5V |
Contrast Out |
|
4 |
1 |
DI |
Data / Instruction |
|
5 |
2 |
RW |
Read =1, Write =0 |
|
6 |
3 |
E |
Data Enabled |
|
7-14 |
4-10 |
Data |
8-bit data |
|
15 |
11 |
CS1 |
Chip 1 select |
|
16 |
12 |
CS2 |
Chip 2 select |
|
17 |
13 |
RST |
Reset |
|
18 |
|
-5V |
Contrast In |
|
19 |
|
+ 5V LED |
LED light + |
|
|
|
‘- 5V LED |
LED light -, Ground |
I could see and save signals flowing to LCD. Channels 1 and 2 define type of information (DI, RW), channel 3 is Data Ready signal (Edge falling). Next 8 channels are data bits. Finally channels 15 and 16 (Chip Select) define left or right part of the LCD matrix.
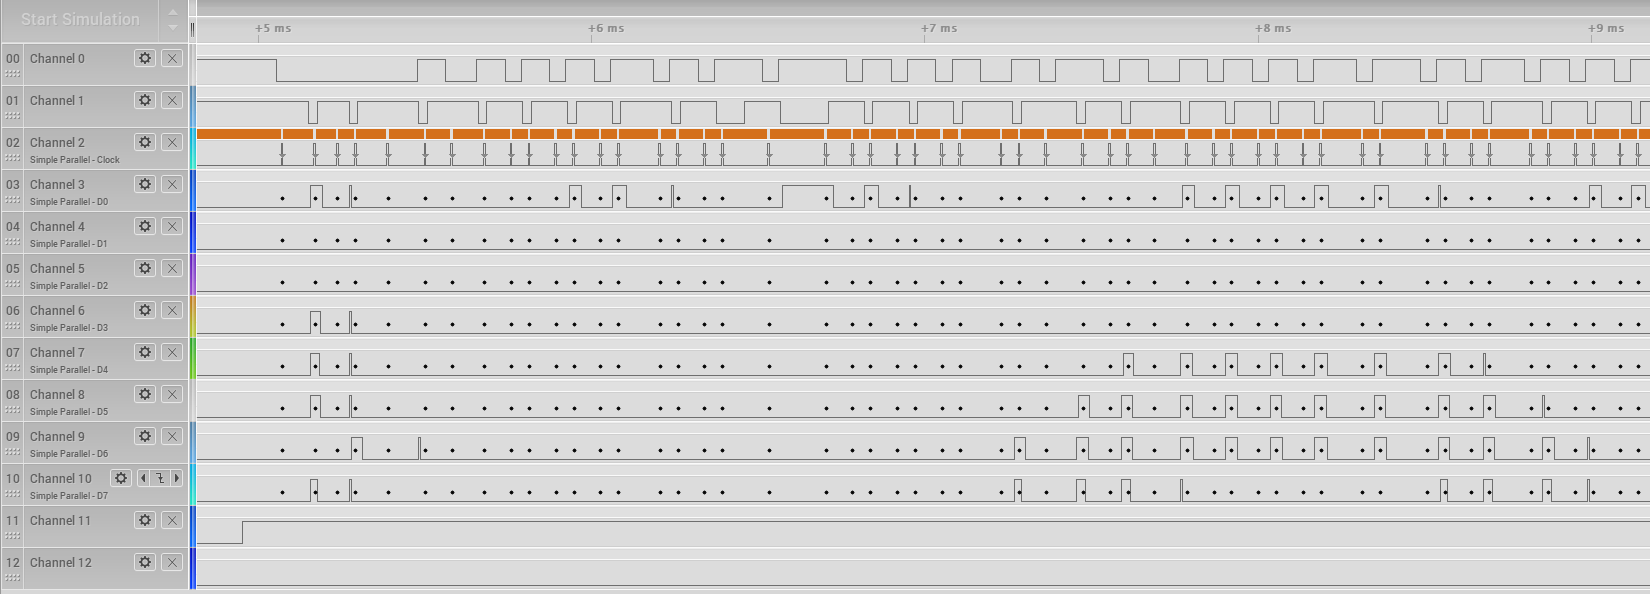
Pic 3: Signals captured by Logic Analyzer
Unfortunately, I could not decode data with built-in protocol analyzers. Reading manuals of several similar LCD displays was of no use.
Reading LCD display image
This particular LCD has some non-standard protocol, so I made my own “analyzer”. I found that “protocol” sends raster bits to appropriate pixels. Display is addressed by 8 Rows with 8 pixels in 2 parts (Left, right / CS1, CS2). For the sake of simplicity, I used VB6.
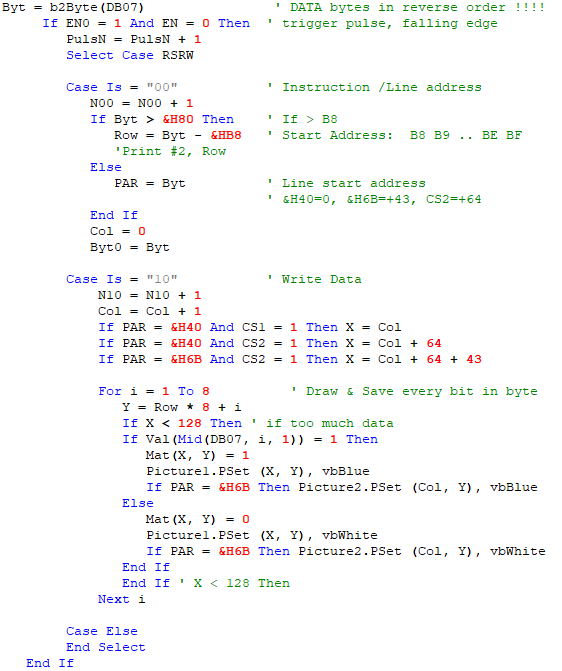
Pic 4:Part of routine to extract pixel values, display them and save in Mat array
LCD image is saved in an array Mat (128x64) of pixel values (0 or 1).
Decoding displayed numbers
As described above, reading LCD communication generates 2-dimensional array of 128x64 bits. To convert this information to values (numbers), I should use OCR program. But I needed just 2 numbers, with digits displayed at fixed positions, so I made my own character recognition program.
To recognize numbers, I first define frames where digits are displayed.
· Small Lambda digits are 5x7 matrices at positions 59,65,71
· Large Absorbance digits are 13x18 pixels at positions 5,11,34,49,64
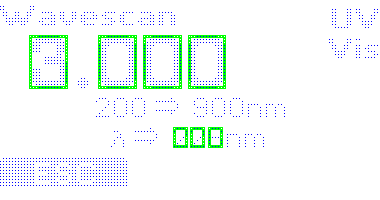
Pic 5: LCD screen displayed on computer, showing digit frames.
Small 5x7 digits are represented by 5 bytes pattern, each byte defined by 1 column of 7 pixels. These 5 bytes, converted to 5 characters string, represent digit’s signature. Similar approach was taken for large digits represented by 39 characters string signature (13 x 3 bytes columns).
These signatures are used to recognize digits in Case statement:
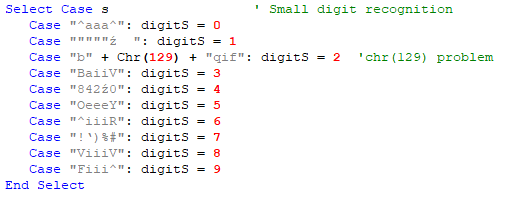
Pic 6: Small digits “fingerprints”
Recognizing LCD numbers and displaying Spectrum
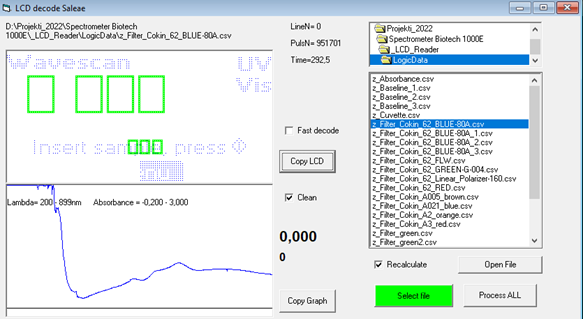
Video (1 minute): LCD number recognition and displaying absorbance spectrum at the end.
Conclusion:
Presented approach works “semi manually” reading LCD signals thru Logic Analyzer with KingstVIS http://www.qdkingst.com/en software, exporting timing data to CSV file and process it via own Analyzer routine.
LCD sniffing using Arduino instead of Logic Analyzer turns out as impossible. I programmed Arduino for reading digital ports https://github.com/mmarchetti/DirectIO , collected LCD pixels in an array and sending it via USB cable to a computer. Unfortunately, I discovered that Arduino is far too slow to read LCD signals. Strobe pulse is 5us wide (200Khz) so for reliable sniffing I should read I/O ports at 1Mhz. The best I could do was reading necessary 13 channels at 80Khz.
Alternatively, I could “program” Logic Analyzer to continuously gather LCD data into a file. This can be done in some stunted way via Socked API. Not a real API, just sending command to Logic Analyzer IDE.
There exists Logic Pirate https://www.seeedstudio.com/Logic-Pirate-p-1750.html that seems to be easy to control and read data. Unfortunately, there is just 8 channel version available. 16 channel version is discontinued.
If you need more information, get source code or share your experience, please write a comment.
Good News:
Finally I found out that there exists a “serial cable” https://www.fishersci.fi/shop/products/spreadsheet-interface-software-exports-result/11380392 that fits into Centronics parallel port. Using logic analyzer, I tested all 25 pins and found non-standard serial signal on pin 1. More about hacking and decoding this this signal will be explained in my next post.