Spectrophotometer Serial reader
In my previous post https://hackaday.com/2022/05/05/exporting-data-from-old-gear-through-lcd-sniffing/ I described how to collect spectral data from the Ultrospec 1000E LCD display by snooping.
This instrument, Ultrospec 1000E, has a 25-pin parallel connector on the rear panel. It is designed for connecting a parallel printer via a Centronics cable. Unfortunately, my model is the "E" (Education) version, which has the printer output disabled. At some point in the user manual, "wavescan mode" is explained.
A plot of absorbance versus wavelength (spectrum) can be output to a recorder via the analog output for permanent recording or viewing the data on the display (absorbance values only). The start and end wavelengths are entered, and a reference scan is performed to store a baseline. Then the sample is scanned and the data is output to the display or recorder in real time. With the appropriate interface, the data can also be output directly to PC.
I discovered that the 25-pin parallel interface can be modified in 2 ways:
·
Display or chart recorder.
Pin 24 is an analog output for the absorbance value. The voltage (U) on this
pin is 100mV per 1,000 absorbance units (A), shifted by 50mV (A = 0.01*U-0.5).
Very nice, but no wavelength output!
·
Output directly to PC with the appropriate
interface
There is a serial cable "Biochrom 80-2109-02" with a software https://www.fishersci.fi/store/products/spreadsheet-interface-software-exports-result/11380392
How can the serial cable work over the parallel interface?
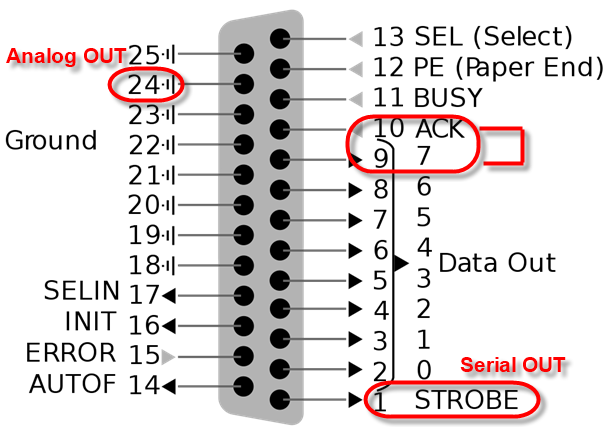
Fig. 1: Standard parallel interface (Centronics) with marked pins. The signal ACK must be HIGH, so I connected to pin DATA (all data pins are normally HIGH).
I decided to check the behavior of all 25 pins with the oscilloscope and discovered that some pins have "some signals". Specifically pin1 - STROBE showed some pulses. I hooked up my Kingst Logic Analyzer and found potentially meaningful pulses when I took the wavescan measurement. Using the KingVis software, I tried the UART/RS232 decoder with default settings (19200bps, 8bits, 1 stop, no parity, LSB first). The only additional trick to get a meaningful detection was the checkbox Inverted RS232.
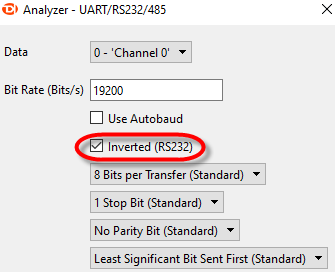
Fig. 2: Logic Analyzer settings for pulse detection
With these settings, the pulses are detected as a serial data stream, tab-delimited ASCII lines, with CRLF at the end. Saving the decoded results to a CSV file allowed me to import the absorption spectrum into Excel and display it in graphical form.
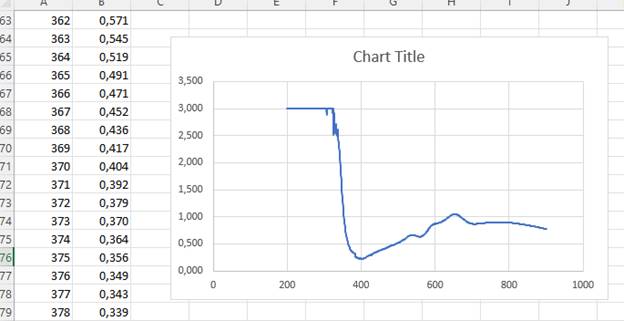
Fig. 2: First diagram of the spectrophotometer seral port. Column A is the wavelength in nanometers, B is the absorbance value.
Acquiring the serial data via the logic analyzer is cumbersome to say the least, so I decided to use a USB interface.
Serial interface
The first thing that came to my mind was to use a TTL_USB adapter, which you can buy at your local hobby/Arduino shop or on Amazon: https://www.amazon.com/Breakout-FT232RL-Serial-Adapter-Converter/dp/B07QB96X4L
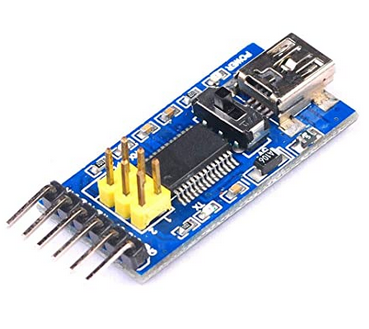
Fig. 3: FTDI USB to TTL serial adapter
The adapter was automatically recognized by Windows 10 as a COMx port, but connecting the serial signal to the RX pin resulted in meaningless data. The trick is in "Inverted RS232", which the card does not offer.
So I soldered 1 transistor TTL signal inverter with 5V power stolen from TTL_USB board.
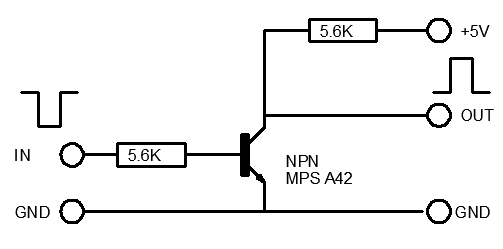
Fig. 4: TTL Signal inverter
Serial reader software
When the spectrophotometer transmits data, the information can be intercepted by a terminal emulator.
![]()
Fig. 5: Data stream displayed in the terminal emulator.
A better approach is to write a program that reads the serial data stream and saves it to a file. This (CSV) file can be used in Excel to display graphs.
I wrote a (VB6) program to collect bytes from the RS232 receive buffer via OnComm interrupt. Using a simple timer trick, the program waits until the data stream starts at the beginning of the measurement. The bytes are collected and stored in memory (string array) until the end of the measurement, then they are saved as a CSV file.
Program sources and sample spectra files can be downloaded from here: www.przan.si/LCD_Sniffer/Spectro_Reader_Source.zip
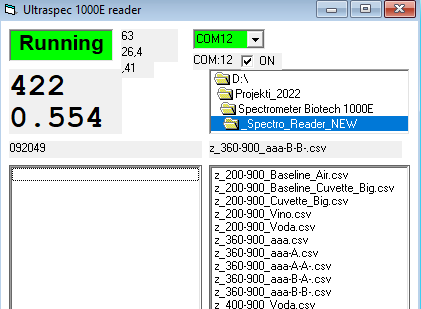
Fig. 6: Reading the spectrum from the serial interface COM12
For easy tracking, the CSV file name is the start time of the measurement and will be renamed to a more meaningful name later.
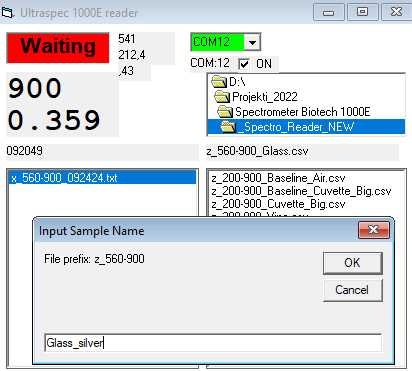
Fig. 7: Renaming the spectrum to a meaningful name.
Spectrum reader
As mentioned earlier, CSV spectrum files can be read by any spreadsheet application, such as Excel. For faster viewing, comparing and analyzing I wrote another program. After selecting the primary and optionally the secondary file, the corresponding graph is displayed. The Y-axis can be the measured absorbance or the calculated transmittance (YT = 10^(2 - YA).
By moving the graphic cursor in the graphic window, wavelength (lambda) and absorption/transmission values are displayed.
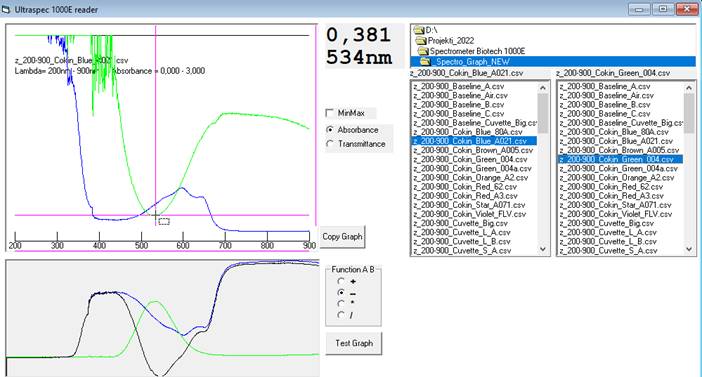
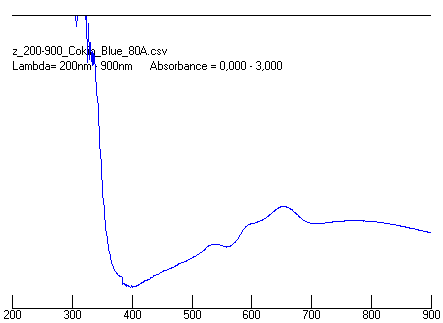
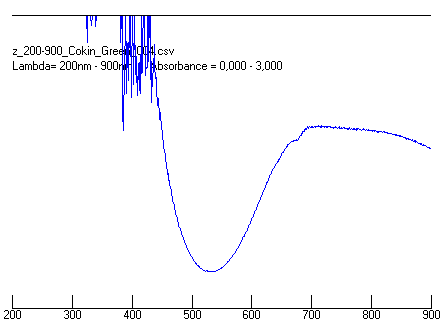
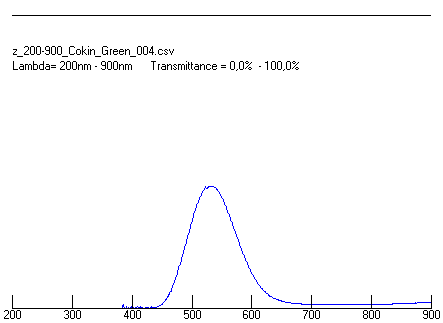
Pic8: Absorbance spectrum of blue and green photographic filters
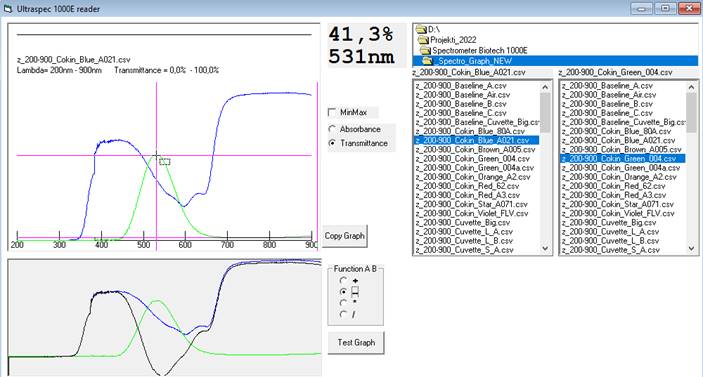
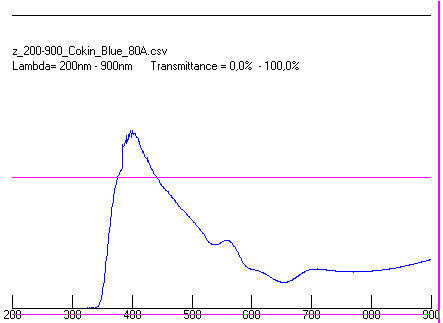
Fig. 8: Transmittance spectrum of blue and green photographic filters
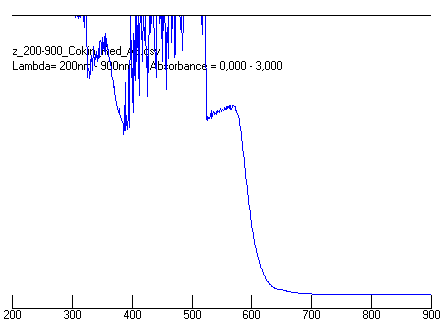
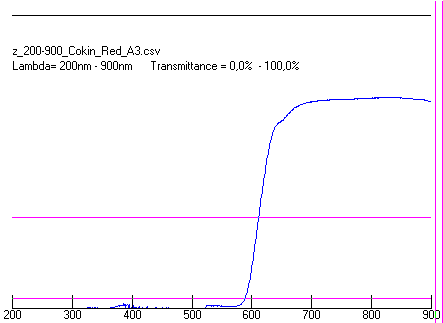
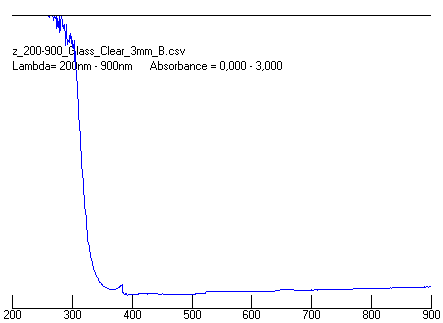
Results:
Some interesting spectra:
· - Color photographic filters (blue, green, red).
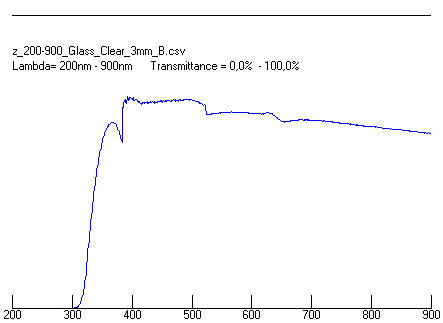
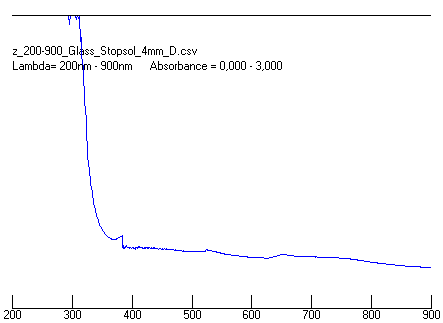
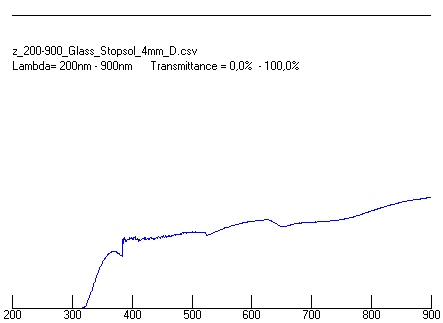
· - Glass (Clear, Stopsol Silver)
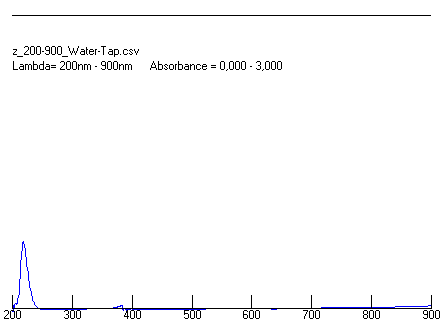
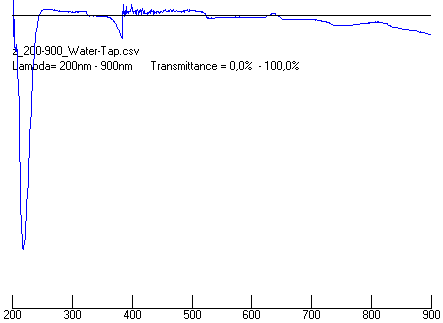
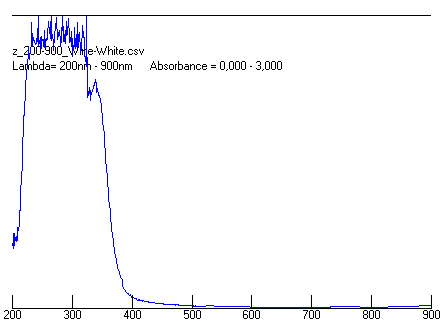
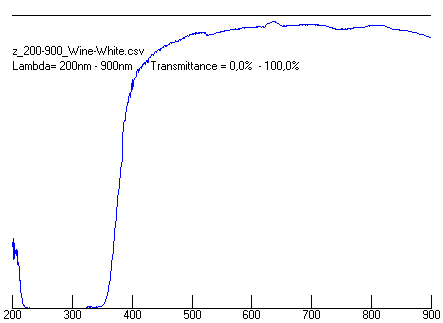
· - Water, Wine
|
|
|
|
|
|
|
|
|
|
|
|
|
|
|
|
|
|
|
|
|
|
|
|
|
|
|
|
Footnote:
This article was corrected using INSTATEXT https://instatext.io/ , a tool that improves style and word choice, corrects grammatical errors, and enriches your content to make it more readable and understandable.